


2020 was quite a wild ride! In the midst of a pandemic and subsequent market turmoil, Regulation CF offerings grew last year. The amount of companies using Regulation CF and other offerings and the amount invested into the online private markets grew exponentially in 2020. The number of raises in 2020 that successfully closed was up 40% from 2019. Additionally, over $186M was raised in 2020 via the online private markets which is an increase of 78% from 2019. This does not cover the majority of Reg D, Reg A+, and even secondary transactions — meaning there was even more growth in the market. For more industry-wide analytics, be sure to check out our analytics page (currently in beta)!
That said, much in the same vein of my colleague’s Year in Review of crowdfunding, I’ll be diving into our Merlin ratings and seeing which states produced companies with high average ratings, the number of companies that scored between different score ranges, and more. As a quick recap, Merlin is our proprietary ratings and analytics platform. We launched the beta version of Merlin in August of last year, so this analysis will be drawing on a limited data set.
This analysis covers all the collected data and rated companies we have on all of 2020’s equity deals. Currently, our ratings only cover startups that are using Regulation CF to raise capital. We plan to add numerical ratings for Regulation A+ raises later this year.
Which States Saw the Highest Average Rating
First, we’ll show which states produced the highest average ratings. Below you’ll see the map, and then we’ll dive into if this means anything.
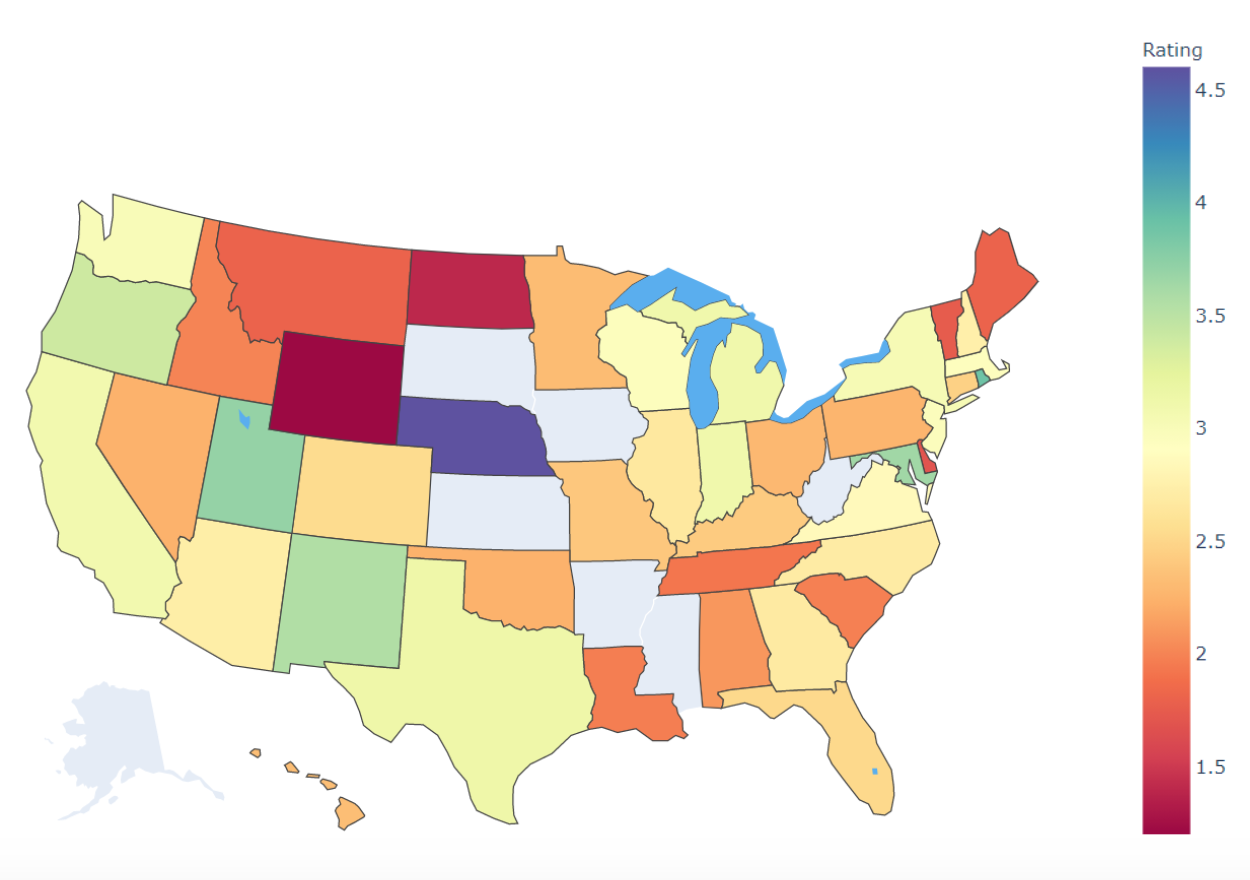
So what is this visualization telling us? The states with a high concentration of talent (California, Texas, and New York) all predictably produced companies with higher than average ratings. Additionally, we should take into consideration the sample size of our ratings as a state like Nebraska produced a company with a rating higher than 4. However, when I dug into the data, there was only one company that we rated in Nebraska — skewing the data a bit. Overall, however, most of the states or US territories were represented.
How Many Companies Scored Between Specific Ranges
Our quantitative ratings help determine our Analyst Reports (Underweight, Neutral, Deals to Watch and Top Deals), but it’ll be interesting anyway to determine what number of companies scored in specific ranges. Let’s jump right to it! Just as a reminder: the higher a company scores, the better investment potential our algorithm sees in it.

Unsurprisingly, most companies scored between 1-2 and companies that scored between 4-5 were at the bottom. What is surprising, however, is that our algorithm has rated more companies between a 3-4 than 2-3. It’s hard to say exactly why that’s the case, but it does seem to indicate that more companies offer positive investment potential than negative. It’s also important that the majority of companies fall in an average score range — that shows that our algorithm isn’t skewed or imbalanced. Additionally, while our algorithm may have scored nearly 200 companies between 4-5, that does not mean a company received a Deal to Watch or Top Deal Analyst Report. Our Analyst Reports are meant to capture and present qualitative aspects of a company that the algorithm can’t easily assess. When a company receives a Deal to Watch or Top Deal Analyst Report, that means it both rated strongly and we saw unique potential in it.
Which Metrics Had the Most Influence
Lastly, we’ll examine which of the major metrics had the most influence on a company’s overall rating. Currently, the five metrics we evaluate companies on are Price, Market, Team, Differentiators, and Performance. For an in-depth look at what is included in each metric, you can visit our Ratings Methodology page. That said, let’s dive in!
Below you’ll find an aesthetically-pleasing correlation matrix. For those that don’t know, correlation is a measure of the linear relationship (causal or not) between two quantitative variables (like height and weight). The correlation coefficient is the resulting number between the two variables and can range from -1 to 1. The closer the efficient moves towards 1, the stronger the relationship. Overall rating, for example, will obviously have a strong relationship with itself because they are one and the same.

This is a lot to take in, but the most important line is the first row. We’re seeking to determine which variable has the strongest relationship with overall rating. In this case, the variables with positive correlations to overall rating are Market, Team, Performance, and Differentiation. This doesn’t come as a surprise given those variables feed into the overall rating.
Performance and Team, however, have stronger correlations. Given how important good leadership is for a startup, it makes sense for Team to be an important metric. A founder with industry experience or past successful exits is much better positioned than one who doesn’t have that kind of background. As for Performance, seeing positive revenues and strong early traction are definitely good indicators that a company has created a product/service that has real demand. And that helps to ensure a positive return on investment.
Price’s negative correlation with overall rating is a surprise. Although it isn’t strongly negatively correlated, the slight negative correlation may indicate it isn’t as important as we believe.
Conclusion
We hope this data gets you excited for the year to come. Here’s to another year of democratizing access to startup investing and continuing to make educated investment decisions in the startup space.


