


Each week, I will be spotlighting some statistics and data points from our various crowdfunding offering sectors. These statistics may serve as a benchmark for the offerings highlighted on the KingsCrowd site in those sectors. For this first week, I take a look at the Technology Sector. Keep in mind that 2020 statistics will be skewed as a result of only having 4 months of data for the year so far.
All graphs are made by the author.
Offer Details
An important thing to examine is the number of offerings within the sector to see what the potential competition for investment dollars (and offering success is). Tech offerings decreased from 2018 to 2019, but appear on pace to increase in 2020. A potential explanation for the dip in 2019 may be due to the large number of tech company IPOs in 2019 that may have motivated firms to go alternative routes for funding to raise larger sums of capital. The mixed success of those raises last year may be driving the return to Reg CF offerings.

It appears that the average round minimum was driven up by offerings launched in 2019 and has decreased slightly in 2020, closer to the overall average.

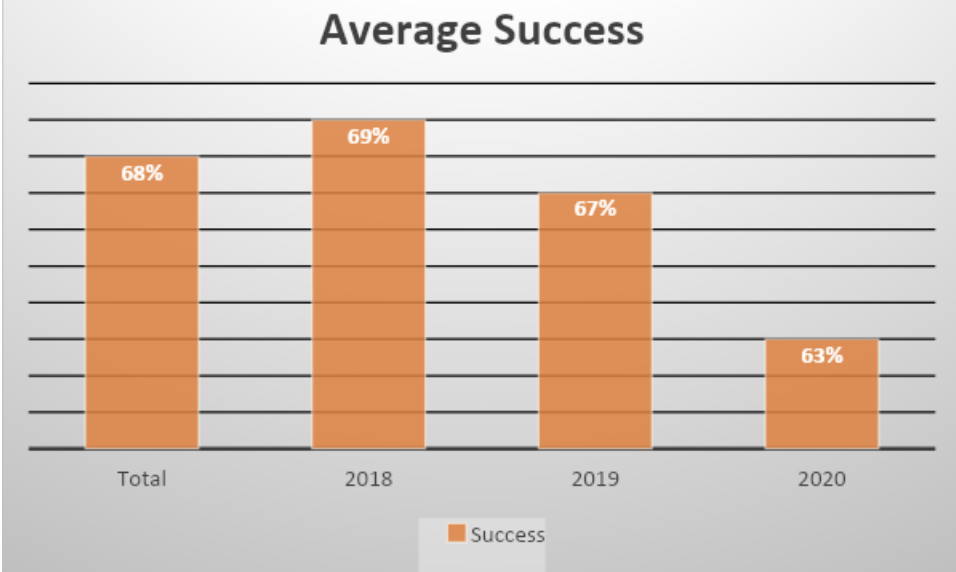
The success rate for offerings in 2020 thus far is below the overall average, as well as the averages for the prior two years. However, a large driver of this decline is the fact that a number of the offerings included in our data have yet to close (or have just started) and still have time to reach their targeted minimums. If this trend were to continue throughout the year however, we may start to be concerned about the performance of this sector in the Reg CF market. However, there are still offerings in this sector which KingsCrowd classifies as a Top Deal or Deal to Watch, so no worry yet on that front.
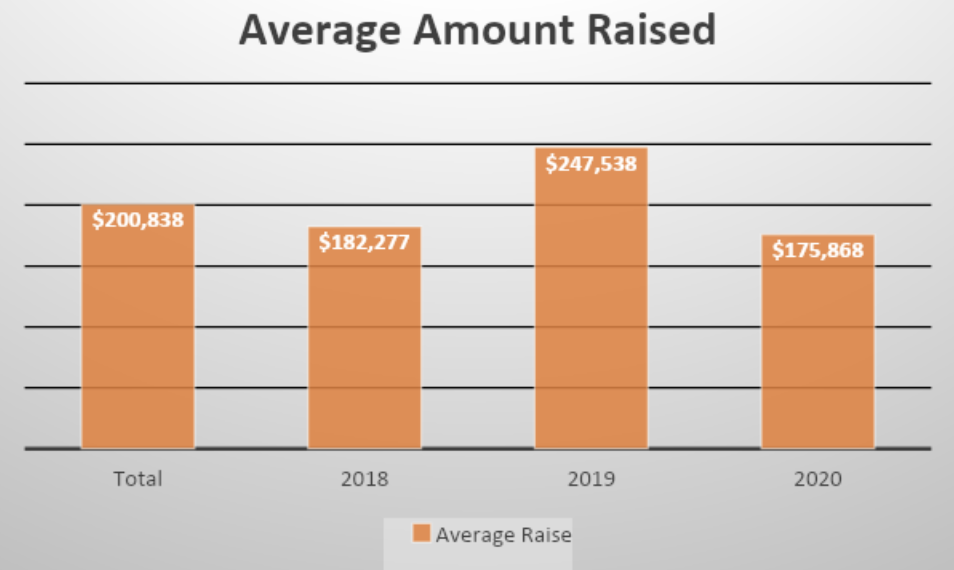
The average amount raised increased from 2018 to 2019, boosting the average raise. Numbers for 2020 appear slightly down, but again, this may primarily be a function of offerings still raising capital, and continuing to raise capital throughout the year. As with the success rate of offerings discussed above, if this number stays low as we progress through the year, there may be more to evaluate as to the cause of this decline.
2019 was a boon for investors in the Tech sector with an increase in almost 300 average investors, and 2020 appears to be on track to raise that average. The increase in average investors in 2019 may be partly attributed to the decline in total offerings in 2019, as there were fewer offerings from which investors could choose. Looking at total investors across the two years (average investor * total offerings), the number of investors across the two years differs by less than 2,000, so this is a likely explanation for the change. What we can tell from this is that there appears to be a fairly sizable investor base for these offerings, and they will take advantage of the opportunities that come their way.

Offer Platforms
In this next section, I break down where the Tech offerings have positioned themselves on the various offering platforms, in total and by year.
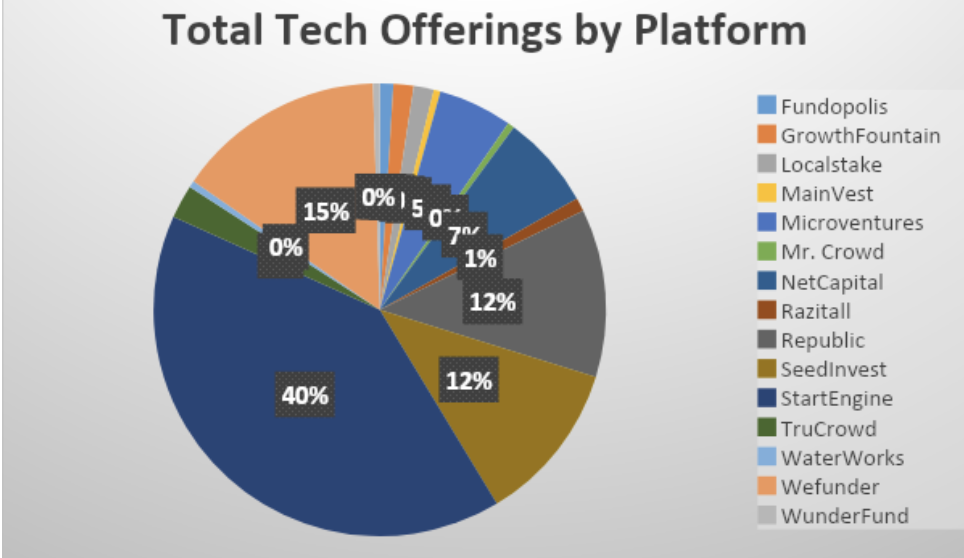
On the whole, StartEngine appears to be the platform of choice for offerings in this sector, accounting for 40% of the total market over the past 3 years. As StartEngine has established itself as one of the primary offering platforms, this does not come as much of a surprise.

A large part of StartEngine’s market share was established in 2018, when it accounted for over 50% of all Tech sector offerings, with only the other two power players (Republic and Wefunder) accounting for more than 10% of the total offerings.

The interesting thing about 2019 was the introduction of new platforms to the sample, including Fundopolis, Wunderfund, and NetCapital. This influx of new platforms contributed to the decline in StartEngine’s market share, but the market still was concentrated at the top by some of the larger platforms (StartEngine, Republic, Wefunder, and SeedInvest).
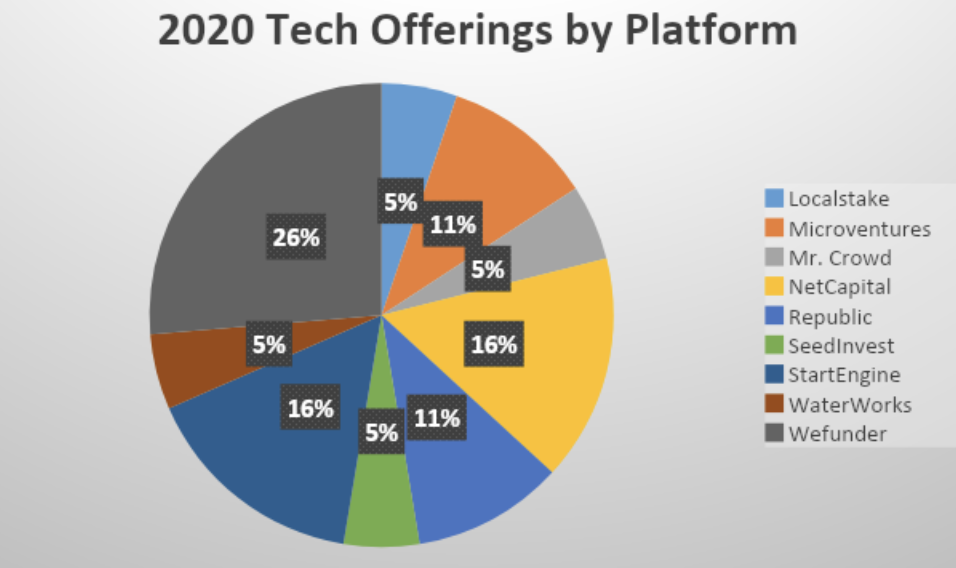
Though still early in 2020, an interesting thing to note here is the appearance of Mr. Crowd as the leading platform of offerings to date in the Tech sector for the year (with StartEngine bumping down to 2nd in market share with NetCapital). As the nature of the industry and equity crowdfunding evolves, it is not surprising to see some certain players begin to carve out a niche in certain industries, which may be what we are seeing here. What this means for investors is that there may be more places to go to seek investment opportunities, adding to the complications of analyzing, tracking, and participating in raises across the various platforms..
Financials
Finally, we close with some statistics on the financial data for some of the companies raising capital through Reg CF. This information is obtained directly from a company’s SEC Form C filing. Information is not yet available for 2020.
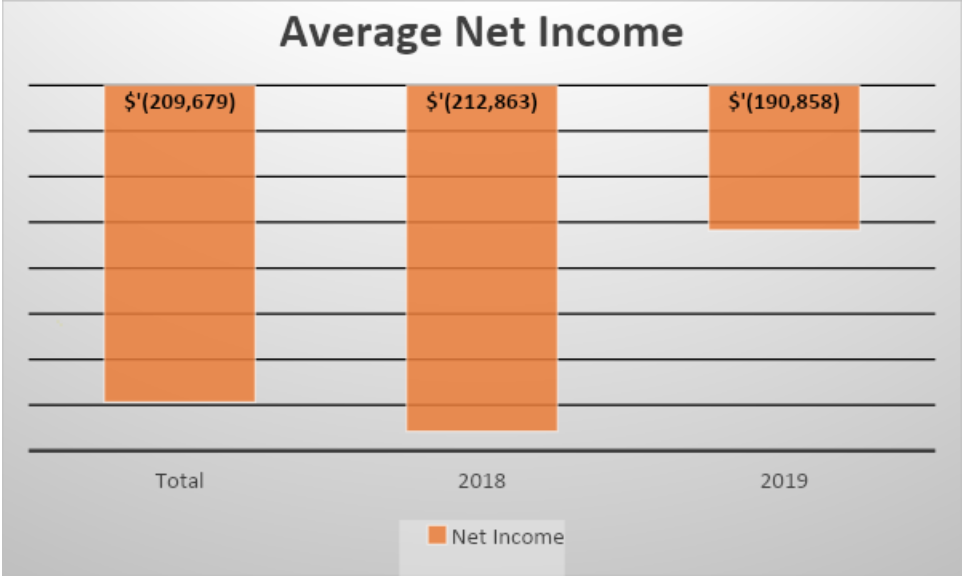
As may be expected, a lot of companies raising money through Reg CF are still in their early stages and have not yet turned a profit, though the trend appears to be firms getting closer to positive income. This pattern suggests that firms who are taking to the Reg CF market may be slightly more seasoned than those in the prior years, or the market has indicated a desire to invest in firms closer, not farther, from profitability in hopes of seeing a quicker return on their investment.
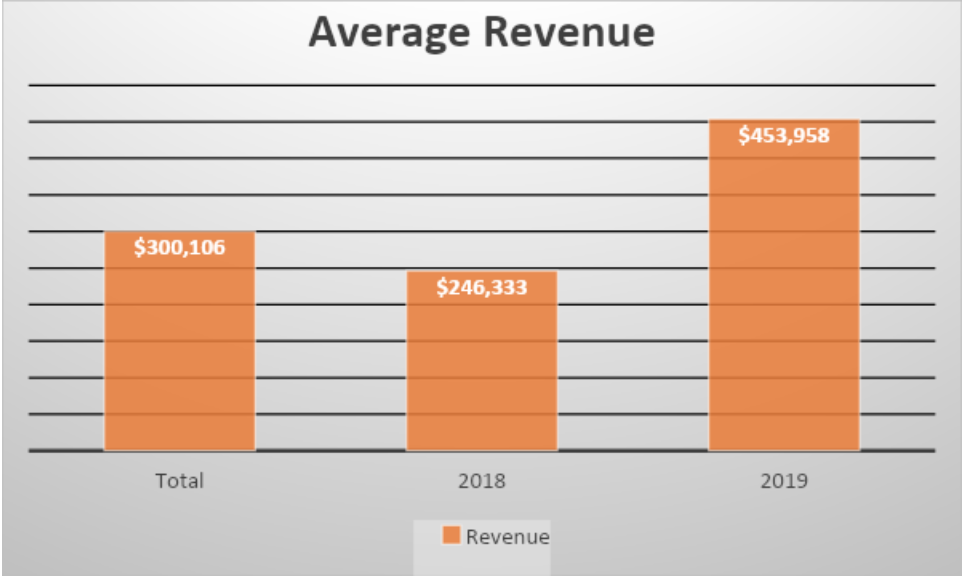
That’s not to say these firms aren’t generating revenue, with firms in 2019 almost doubling revenues of 2018 offerings. This trend would also appear consistent with the pattern in net income that we see above, as firms that have been around an extra year or two may have advanced past the pre-revenue stage. This again could be an indication that investors are looking for proof of revenue in companies that are looking for the pool of Reg CF investment dollars
Some Tech firms KingsCrowd is looking at:
Sunu – A Top Deal
Cloudastructure – A Top Deal
Jetoptera – A Deal to Watch
BioLargo – A Deal to Watch


